WorldShare Reports in Power BI release notes, January 2025
Release Date: 30 January 2025
Introduction
This release of WorldShare Reports provides new features and enhancements. These features will help you manage more complex workflows, including:
- Utilize the new Microsoft Power BI reporting platform for WMS and Tipasa
- View new standard Circulation reports built on the Microsoft Power BI platform
- View new standard Patron user reports built on the Microsoft Power BI platform
- View a new standard LHR report built on the Microsoft Power BI platform
- Utilize powerful bookmarking and favoriting features
- View new circulation event type for loans that transition to long overdue
New features and enhancements
Utilize the new Microsoft Power BI reporting platform within WMS
All reports screen
The All reports screen opens after you click Reports / Visualizations tab in the left navigation. This screen contains a customizable reports table from which you can launch standard reports. The image below is an example of this screen.
You can click the Show Sidebar button ( ) to hide or show the left navigation for the Analytics module. Hiding the sidebar expands the reports screen and enhances the report visuals. By default, the sidebar is shown.

1. Search
Use the Search text field to find a specific report. This is an auto-filter text field. Filtering of reports starts after the first keystroke in the text field.
Queries entered in the Search text field search across all available columns in the reports table (even hidden columns).
2. Customize the table view
Use the Customize table view buttons to change the All reports table. Any changes you make to the table will remain in future sessions until you reset the table to its default or make additional changes.
| Action | Button | Description |
|---|---|---|
| Show filters |  |
Use the Show filters button to filter the available reports by column and value. To apply a filter:
To remove an applied filter:
|
| Show columns |  |
Use the Show columns button to select and deselect the columns in the All reports table. By default, five columns are shown in the table. You can use drag and drop to rearrange the order of the columns in the reports table. To show a column:
To hide a column:
From the Show columns dialog, you can also:
|
| Reset to default |  |
Use this button to reset the All reports table to its default setting. |
 ) to remove a single filter from the table.
3. Rows
The number of rows per page and page navigation buttons appear at the top and bottom of the reports table.
- Select a number from the Rows drop-down list to change the number of rows you see per page. Options include:
- 20 (default)
- 40
- 60
- If there is more than one results page, use the navigation buttons to move between pages. Options include:
- |< - Click to return to the first page of results
- < - Click to go back one page
- > - Click to move forward one page
- >| - Click to move to the last page of results
Run a standard report
- In the left navigation, click Reports / Visualizations. The All reports screen opens.
- Click the name of the report you wish to run in the Title column. The report will open on the same screen.
- Click All Reports to return to the All reports screen.
Filter a standard report
By default, all standard reports have one or more filters applied, and the filter pane is hidden. You can apply basic or advanced filtering to a report visual.
Basic filtering
- From the open standard report, click Filters to expand the filter pane.
- Click the Expand or collapse filter card button (
 ) for the filter you'd like to adjust.
 - Select the filter value(s) you want to include or deselect the filter values you wish to exclude from the list of filter values. Your selections or deselections are automatically applied to the report visual(s).
Advanced filtering
- From the open standard report, click Filters to expand the filter pane.
- Click the Expand or collapse filter card button () for the filter you'd like to adjust.
- Select Advanced filtering from the Filter type drop-down menu.
- Select an operator from the Show items when the value drop-down list.
- Enter a value in the text field below the operator drop-down list.
- (Optional) Add a second value to your advanced filter.
- Select a Boolean operator.
- And (default)
- Or
- Select an operator from the drop-down list.
- Enter a value in the text field below the operator drop-down list.
- Select a Boolean operator.
- Click Apply filter to apply the advanced filter to the report visual.
Standard report screen
After execution, every standard report page contains five key areas.

1. Navigation
The navigation contains an All Reports link, which returns you to the All reports screen and the title of the currently open report.
2. Favorite
You can favorite or unfavorite a report from the standard reports screen by clicking the star.
- Favorited reports have a solid star (
 ) and appear at the top of the All reports table.
 - Unfavorited reports have star outline (
 ).
).
3. Report toolbar
In addition to displaying the Last data refresh date, the report toolbar contains the following:
| Item | Format | Description |
|---|---|---|
| File | Menu | The File menu allows you to:
|
| Bookmarks | Menu | The Bookmarks menu allows you to bookmark a view of the report. |
| Reset to default | Button | After adjusting the filters, click the Reset to default button to reset the report to its default settings. |
4. Report visuals
Each standard report contains one or more visuals. When you hover over a visual, a menu with one or more buttons will appear.
Filters and slicers affecting this visual button
Click the Filters and slicers affecting this visual button ( ) to view the filters and slicers generating the visual. The filters and slicers listed in the dialog are not editable.
Focus mode button
Click the Focus mode button ( ) to view and interact with the visual on its own screen. The Filters and slicers affecting this visual, and More options buttons appear on this screen.
Click Back to report above the isolated visual to return to the report screen.
More options button
Click the More options button ( ) to view the More options pop-up menu. One or more of the following options appear in the pop-up menu, depending on the visual you've selected.
- Export data - Click to export data from the visual.
- Show as a table - Click to present the visual data in a table.
- If selected, the visual and table will display together on a new screen.
- Click Back to report above the visual to return to the report screen.
- Spotlight - Click to highlight the visual, which causes the other visuals in the report to fade to near transparency.
- Get insights - Do not use.
- Sort axis - Hover over this option to view the default filter and sort affecting this visual.
- The default filter or slicer will have a checkmark before it. Click a different filter or slicer to change the visual.
- The default sort method will have a checkmark before it. Click a different sort method to change the visual.
5. Report filters
Export a standard report
You can export a standard report from the File menu to your local workstation as a PDF, PowerPoint (PPT), or PNG file.
Note: Exporting a standard report from the File menu results in an export snapshot of the report visual(s) as they appear on your screen only. You must export data from the individual report visual(s) to view all report data in that visual.
- Click File > Export. and then select one of the following export formats.
- Select an export file type from the flyout menu.
- PowerPoint (PPT)
- PNG
- The file will automatically begin downloading to your workstation.
Export report data from a report visual
You can export report data from each visual in the report.
- Hover over a visual and click the More options button ().
- Click Export data in the pop-up menu. The Which data do you want to export? dialog.
- From the dialog:
- Select one of the following export formats if you export data from a tab or matrix visual.
- Data with current layout - Exports data as a plain table with no styling or filters.
- Summarized data - Exports data as a table with filters enabled for each column and alternating colored rows.
- Select a file format from the drop-down list if exporting the data as Summarized data.
- .xlsx (Excel 150,000-row max) (default)
- .csv (30,000-row max)
- Click Export. The file automatically downloads to your workstation.
- Select one of the following export formats if you export data from a tab or matrix visual.
- (Optional) Repeat steps 1-3 for each additional visual in the report.
Print a standard report
You can print a report by exporting it to a PDF file.
- From the open report, click File > Print. The Print dialog opens.
- Set your printing options in the Print dialog.
- Click Print. The report will automatically begin downloading as a PDF file to your workstation.
- Open your workstation's Downloads folder to retrieve and print the report.
View new standard Circulation reports built on the Microsoft Power BI platform
Circulation Events Detail
The Circulation Events Detail lists the circulation event transactions within a specified date range. By default, this report displays data for all circulation event types for the last 30 days. This report can analyze detailed circulation transactions by date, loan policy, call number, material format, or borrower category.
This new version of the report adds the following columns:
- Event Pickup Branch Name
- Event Pickup Branch Location
- Event Transaction Source

Daily Payments
The Daily Payments Report displays details of payments by branch and payment method with a specified date range. The default date range is one day back. It provides a visual for the number of payments, the amount paid by the branch, and the payment method. There is also a list of payments received during the selected date range. You can use this report to reconcile a circulation cash drawer.

High Use Circulation Titles
The High Use Circulation Titles report lists titles identified as high use (based on circulation activity, such as checkouts, renewals, and holds) within a specified date range. By default, the range is the last six months of activity. It provides details of an item’s title, OCLC number, and the count of activity ranked. You can use this report to determine your institution’s most popular items.

Hourly Average Circulation Activity
The Hourly Average Circulation Activity report displays a chart of average circulation activity by hour within a specified date range for selected branch(es) for the selected day(s). The default date range is the last six months of activity. This chart is interactive, and after you select or deselect event types, the chart regenerates. You can use this chart to display busy and slow times at the circulation desk and provide decision support on staffing levels needed.
This report also allows you to "Personalize this visual", to select which metrics you want to use to evaluate hourly activity at your branches. For example, you may want to include bills paid, bills created, etc., in your activity. Hover over the visual and click the "Personalize this visual" button ( )
) to activate the option.

This report also allows you to "Personalize this visual" by selecting which metrics you want to use to evaluate hourly activity at your branches. For example, you may want to include bills paid, bills created, etc., in your activity. Hover over the visual and click the "Personalize this visual" button () to activate the option. Click the + option to add report objects to your visual. To remove any report objects, click the three dots to "Remove field".

Monthly Circulation Statistics
The Monthly Circulation Statistics report displays circulation statistics for items checked out, hold item consultations, items soft checked out, and circulation statistics total. You can view these events by year and month, material format, borrower category, permanent shelving location, and temporary shelving location. New to this report is the available reporting by call number classification. The default date range is the last 12 calendar months. It provides details at the month and year level. You can use this report to count items checked out, soft checked out, and item consulted.

View new standard patron user reports built on the Microsoft Power BI platform
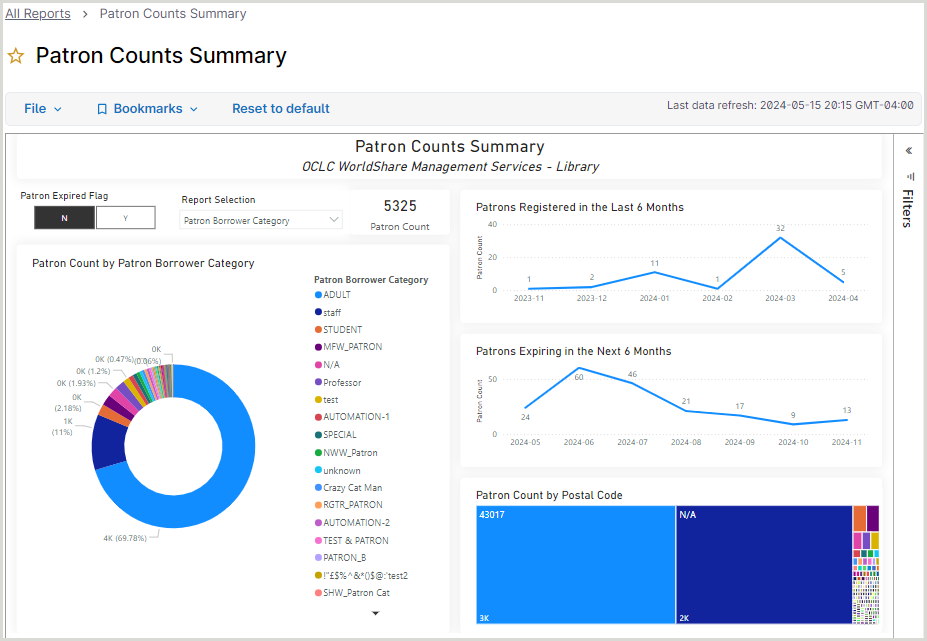
Patron Counts Summary
The Patron Counts Summary report displays patron counts by branch, custom category (e.g., major, class year), borrower category, and postal code (zip code). It provides information about the number of borrower or custom category patrons. You can use this report to verify a patron load or analyze the registered borrowers' distribution by category. In addition, visuals are provided for counts of patrons recently registered and approaching expiration.
Patron Information Detail
The Patron Information Detail Report lists detailed information that includes many data fields in the patron record. You can use this report for data cleanup (e.g. finding patrons with missing borrower category or home branch), projects, and troubleshooting.
This new report version adds Patron Public Notes and Patron Staff Notes columns.

View a new standard LHR report built on the Microsoft Power BI platform
LHR Duplicate Barcodes
The LHR Duplicate Barcodes report displays where a single barcode value has been used in multiple LHR items to help your library clean up LHR and circulation data. KPIs are provided for a quick look at counts of barcodes that have duplicates and the number of groups of duplicate barcodes.

Bookmark a standard report
You can bookmark a report after adjusting the report filters. Bookmarking the report allows you to revisit a particular view without resetting filters.
Each standard report has a preset default Standard bookmark, which correlates to the report's default settings. You can set a bookmark you created as the default so that you always see that report view when you open the report in subsequent sessions.
Add a bookmark to a standard report
- From the open report, click Bookmarks > Add bookmark.
- Enter a name for the bookmark in the Bookmark name text field.
- (Optional) Select the Make Default checkbox to make this the default view when you open the report.
- Click Save to save the bookmark.

Edit an existing bookmark in a standard report
You can change the default bookmark or rename an existing bookmark in the Bookmarks menu.
Change the default bookmark
- From the open report, click Bookmarks.
- Locate the bookmark you want to make the default and click the More options button (
 ).
). - Click Make default. The bookmark now has a default icon next to it, and a confirmation message appears stating Default Bookmark Changed.
Rename a bookmark
Note: The Standard bookmark cannot be renamed.
- From the open report, click Bookmarks.
- Locate the bookmark you want to rename and click the More options button ().
- Click Rename and enter a new name in the text field.
- Click Save. The bookmark name changes, and a confirmation message appears stating Bookmark Renamed.
Delete a bookmark from a standard report
Note: The Standard bookmark cannot be deleted. If you delete one of your own custom bookmarks that is set as your default, the Standard bookmark will then become your new default.
- From the open report, click Bookmarks.
- Locate the bookmark you want to delete and click the More options button ().
- Click Delete and then click the Delete button in the Bookmarks menu. The bookmark is deleted, and a confirmation message appears stating Bookmark Deleted.
View new circulation event type
Starting 19 January 2025, you can view a new circulation event type named Transition-to-Long-Overdue. This audit event is written when the Circulation application transitions a loan to long overdue. This new event type will be viewable in both the existing BusinessObjects Circulation Events reports and universe and the new Power BI report Circulation Events Detail.

Known issues
- N/A
Important links
Post-release sessions
An Office Hours session is scheduled to help you familiarize yourself with the new features and enhancements included in this release. Please note the session time zones when registering. The session will be recorded and archived for future viewing on the OCLC Community Center. Even if you cannot attend, please register to receive a link to the recorded session.
WorldShare Report Office Hours
Date: Tuesday, 25 February 2025, 11:00 am, Eastern Standard Time (New York, GMT-05:00)
Registration: https://community.oclc.org/t5/worlds...ec-p/56348#M47
Support website(s)
Support information for this product and related products can be found at: