How do I create a report to show Duplicate titles in different Shelving location?
Applies to
- WorldShare Reports
- Report Designer
Answer
You can create a report by using the Report Designer in Analytics and by using the LHR Item Detail Universe and by adding in a subquery filter.
Steps to create this report:
1. Go to Analytics > Reports > Report LaunchPad.
2. Select Application > Web Intelligence > New > Universe > OK.
3. Select LHR Item Detail Universe > OK.
4. Select the Result objects (what you want to see in your report);
You can either double-click on each of the required objects or drag it across to the Result Object box for them to appear.
5. Select the Title folder > OCLC number > Double click on the Report Object.
6. Select the Title folder > Title > Double click on the Report Object.
7. Select the Title folder > Author Name > Double click on the Report Object.
8. Select the LHR Item Detail folder > LHR Control number > Double click on the Report Object.
9. Select the LHR Item Detail folder > LHR Item Branch Name > Double click on the Report Object.
10. Select the LHR Item Detail folder > LHR Permanent Shelving Location > Double click on the Report Object.
11. Select the LHR Item Detail folder > LHR Item Barcode > Double click on the Report Object.
12. Select the Measures folder > LHR Item Count.
Now you need to set the special filter to bring in all Titles with more than only 1 Holding (LHR):
- Select OCLC number in the Report objects box, so highlighted
- Select the Add a Subquery icon at the top of the Query Filters box.
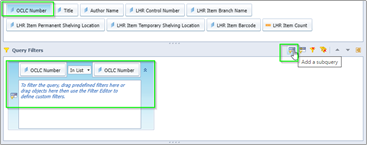
- Select the Title folder > OCLC number > and drag it across into the filter box
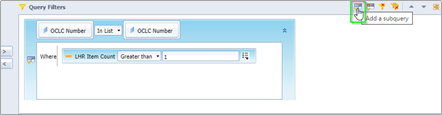
- Select the Measures folder > Select the LHR Item Count > drag next to where in the sub-query box
- Select Greater than & type 1.
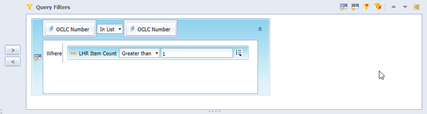
- Select Refresh to see what data will be pulled in.
-
If satisfied with the data being returned, select Run Query.
-
To stretch out the columns, hover the mouse pointer near the blue column edges and drag sideways.
-
You can export your report to Excel, using the export options.
-
You should always save these created reports in your 2.0 Folder giving them a name that helps you remember what it was created for.