Create a custom report
Learn how to create a custom report.
Queries are used in Web Intelligence to access data. Rather than having to know the specifics of formal Structured Query Language (SQL), you only need to know which universe the data that you want is stored in, the data object requested, and its basic relationships to get started.
Reports are built in the Query Panel using Report objects.
Note: Report Designer times out after 20 minutes of inactivity.
Create a query
In this example, you are going to create a report listing the amount expended on items received during a given time period. This report uses the following objects in the Acquisitions universe:
- Dimensions: Title, Publication Date, Shelving Location, Fund Name Level 1, Expended Amount, Received Date
- Measures: Expended Amount
- Completed query in Report Designer
- In the left navigation, click Report Launch Pad.
- Select Web Intelligence from the Applications drop-down list in the upper right-hand toolbar.
- Click the New button (
 ).
). - Double-click Universe.
- From the Universe dialog, double-click Acquisitions.
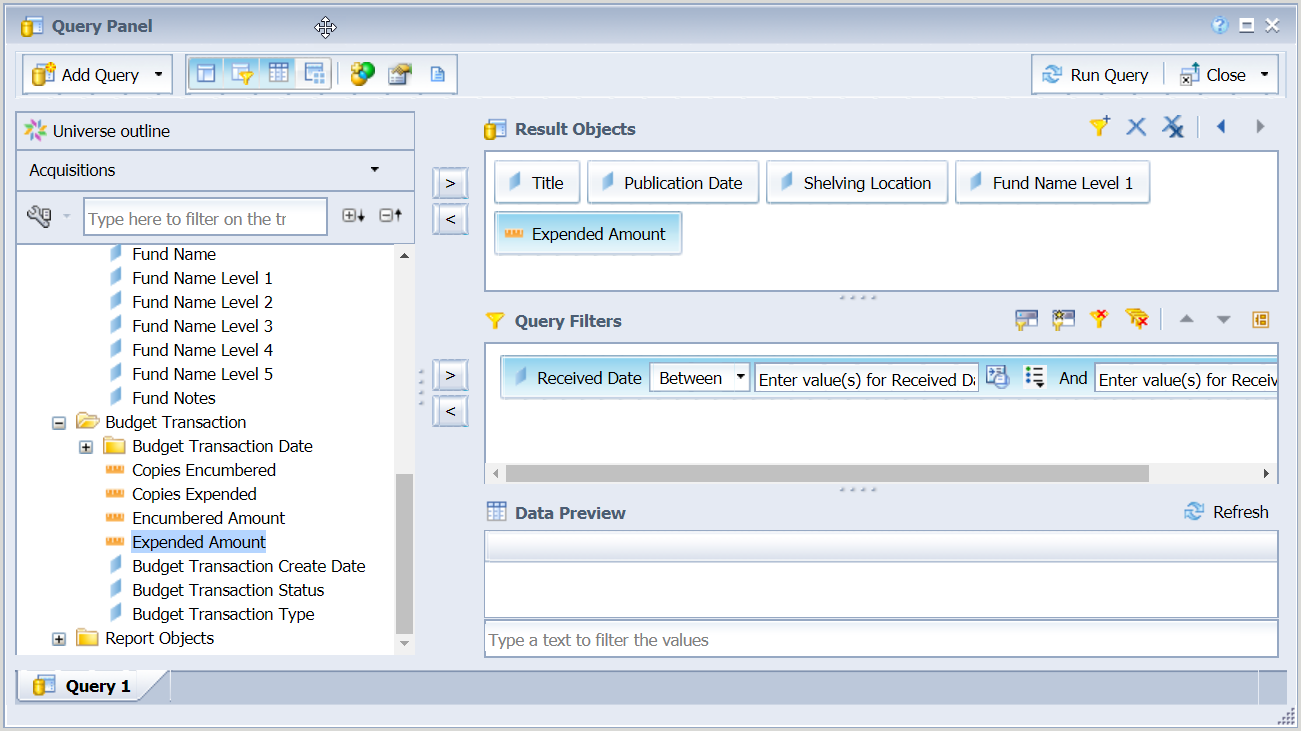
- In the Query Panel, expand the Title folder and then double-click Title and Publication Date. Title and Publication Date now appear in the Result Objects panel.
- Expand the Copy folder and then double-click Shelving Location. Shelving Location now appears in the Result Objects panel.
- From the Copy folder, expand the Received Date folder and then drag Received Date to the Query Filters panel.
- Expand the Budget / Fund folder and then double-click Fund Name Level 1. Fund Name Level 1 now appears in the Result Objects panel.
- Expand the Budget Transaction folder and then double-click Expended Amount. Expended Amount now appears in the Result Objects panel.
- Select Between from the Query drop-down list.
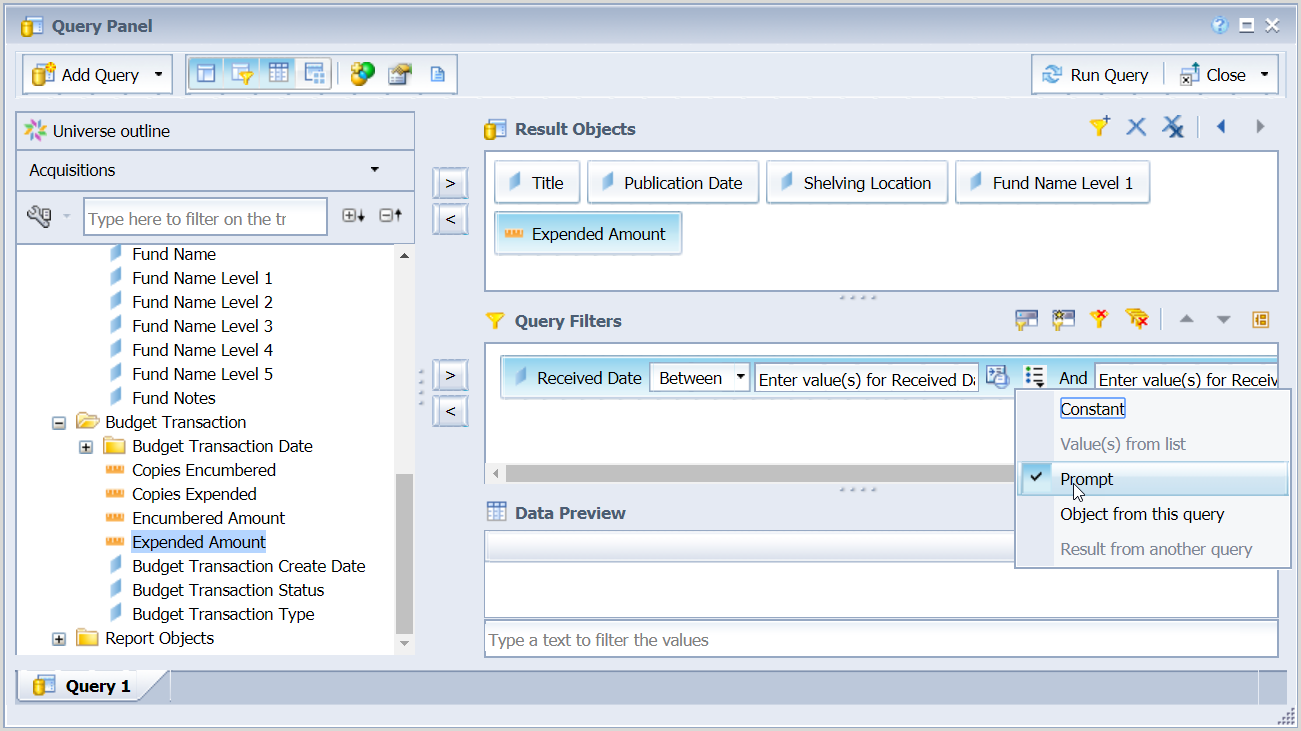
- Select Prompt from the Define filter type drop-down list (
 ) after each operand.
- Define filter type - Example
- (Optional) Click Refresh above the Data Preview panel to produce a preview of the data that will be generated once your query is run. Verify that your desired data is included in the order you prefer.
- Click Run Query.
If you save your custom report, it will be available in search after 24 hours.