Run reports
Run a standard report
- In the left navigation, click Reports.
- Click a report category accordion to expand the menu.
- Click the name of the report you wish to run. The report will open in a new browser tab.
- Enter the required prompt values.
(Optional) Enter or adjust any optional prompt values. See the Prompts dialog below for more information. - Click Run to run the report.
Watch a video
Standard reports
Run time: 3:20
In this video, you’ll learn about WorldShare Reports, specifically standard or pre-defined reports. You’ll learn how to access the reports, use prompts to specify the data to include in the reports, and use the filter bar to refine the report results.
Run a standard report (Report Designer only)
With report authoring permission, you can access metadata reports from Reports in the left navigation.
- In the left navigation, click Classic Launch Pad.
- From the Folders screen, click a report category folder.
- Click the name of the report you wish to run.
- Enter the required prompt values.
(Optional) Enter or adjust any optional prompt values. See the Prompts dialog below for more information. - Click Run to run the report.
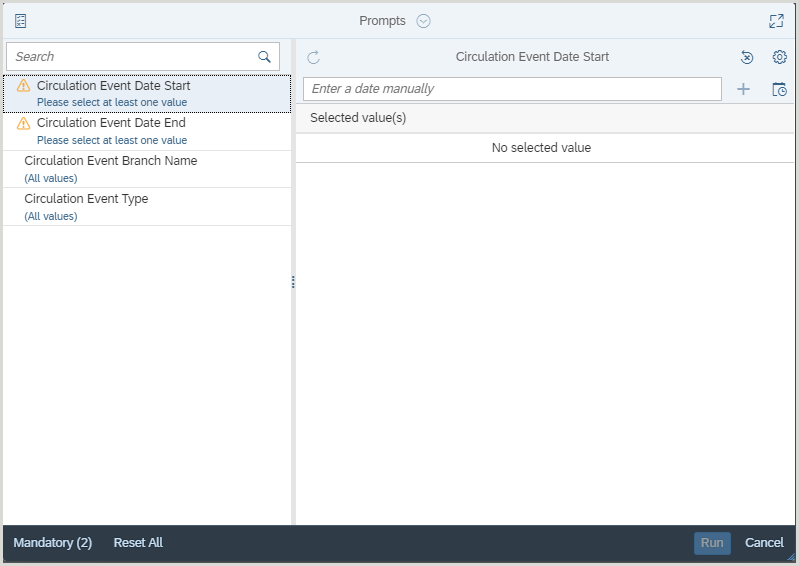
Prompts dialog
A standard report will only run once all fields in the Prompts dialog are marked with a green check mark.
When you run a standard report, the Prompts dialog may require you to enter a value for a mandatory field prior to running the report. Prompts vary depending on the data in a specific report, and it may be mandatory to enter several values before a report will run. Standard reports use a combination of three different prompt fields: Optional, Pre-populated, and mandatory.
- Report prompts dialog - Example
Optional fields
An optional field may be left blank. If an optional field is left blank, the report will display all available values for that field. If a value is entered for an optional field, the report will display data for that value only (e.g., a specific branch).
Pre-populated fields
A pre-populated field provides a value for a prompt. You can modify a pre-populated field or accept the default value.
Mandatory fields
A mandatory field, identified by a red arrow (mandatory-field), is blank and requires you to provide a value before the report will run. If the field is a date prompt, it will provide an example of how to format the date in the text field (e.g., M/d/yyyy). Many date prompts provide a date picker, which allows you to set the date from a calendar.
Edit a prompt value
After you run a report, you can edit your initial prompt selections through the Prompts dialog. To open the Prompts dialog, click the Refresh all refreshable data providers button ( ) in the Query tab.
To edit a prompt value:
- Select the prompt you want to edit in the left navigation.
- In the prompt panel:
- Enter a new value for a single value prompt.
- Select or deselect values for a multi-value prompt.
- Click Run to refresh the report with your new prompt values.