EZproxy Analytics visualizations
Visualizations allow you to create graphic representations of your data. EZproxy Analytics comes with many default visualizations, and allows users to create their own.
Access visualizations
To access existing visualizations and create your own:
- Sign in to your EZproxy Analytics site using the username and password provided by OCLC. Your EZproxy Analytics dashboard opens.
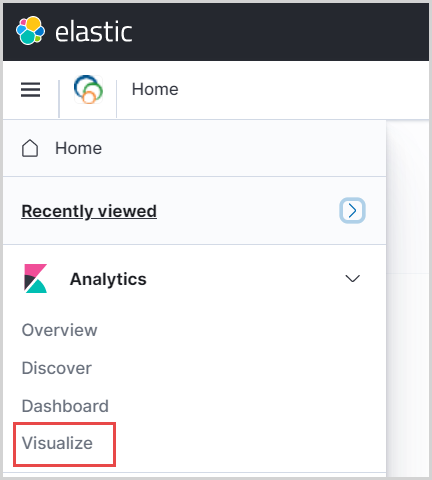
- Click on Visualize in the left pane. A table of available visualizations appears, displaying the Title, Type, Description, and available Actions.
Note: To expand or hide the left panel, click the
 icon at the top of the menu.
Available visualizations
EZproxy Analytics comes with a number of out-of-the-box visualizations to allow you to quickly put your data to use.
| Name | Description |
|---|---|
| Access event by region map | Visualize where your users are accessing resources. |
| Access events by date/time | Daily counts of the total access events after patrons log in to EZproxy. |
| Access event terms | Dictionary of the audit security event terms. |
| Audit event map | Visualize where users are logging in and out from. |
| Audit event terms | Dictionary of the audit security event terms. |
| Audit events by date/time | Helping to show busy times in your library. |
| Count of access events | At-a-glance sum of the total access events after patrons login to EZproxy. |
| Count of successful logins | At-a-glance indicator of how active your library is. |
| Count of login failures | Stay informed about potential hurdles to access |
| Count of SPU Events | At-a-glance indicator of your gate counts |
| List of journal use counts | A data table of use counts per journal. Does not include platforms that have zero use. |
| List of platform use counts | A data table of use counts per platform. Does not include platforms that have zero use. |
| List of Publication_Title Use Counts | A data table of use counts per journal. Does not include platforms that have zero use. |
| List of Referer Domains | A data table of use counts per referer domain. |
| Login Counts by User Desc | A data table of patrons login counts. |
| Login failures by user | Show users that may need help or potential bad actors. |
| Logins from Multiple Geographies | Visualize where users are logging in from. |
| Logins top 5 countries | Display which countries are most popular destinations for patrons. Or, reflect usage at international branch campuses. |
| Logins by group | Show what types of users are logging in. |
| Logins from multiple geographies | Visualize where users are logging in from. |
| Platforms by groups | Top 5 platforms broken down by groups |
| Security counts by Continent, Country, Region, and City | Show login counts sortable by continent, country, region, or city. |
| Security Events | Data table that shows audit event counts. |
| Security Event Map | Coordinate Map of Login Locations. |
| Session ID Lookup | Paste in an EZproxy session ID to filter audit events by EZproxy session id. |
| Top 10 journals | Visualize which journals and platforms are most important. |
| Top 10 Publication Titles | Horizonal Chart of the top 10 publication titles. |
| Top 10 publisher | Vertical chart of the top 10 platforms. |
| Top 10 publishers | Chart of the top 10 publisher names. |
| Top 10 platforms by MIME type | See what types of resources are important, informing purchasing decisions. |
| Top 5 platforms by Resource type | See what types of resources are important, informing purchasing decisions. |
Search and filter within visualizations
Data within visualizations can be searched and narrowed down using pre-selected fields from the Discover tool. For more information, see Search and Filter.
Create visualizations
Select the Create visualization button at the top of the screen to begin a new visualization. The Lens tool allows you to create visualizations by dragging and dropping the available field filters.
After selecting the type of visualization, select the corresponding log type you would like to search against.
- If you selected the wrong log type, you click the Visualize breadcrumb at the top left to go back and repeat the steps above.
Select the corresponding X and Y axis for your data and visualization type. In EZproxy Analytics the X-axis are called buckets and the Y-axis is generally the summaries or counts of the X-axis. After selecting the correct metrics (Y-axis) and buckets (X-axis), remember to save your visualization.
For information about how to shape your data using charts, tables, and other tools, see Kibana > Create panels with editors. Please note, this documentation is provided for reference only and is not supported by OCLC. The user interface and access points may look different from OCLC-supported EZproxy Analytics.
Save and share visualizations
To save a visualization:
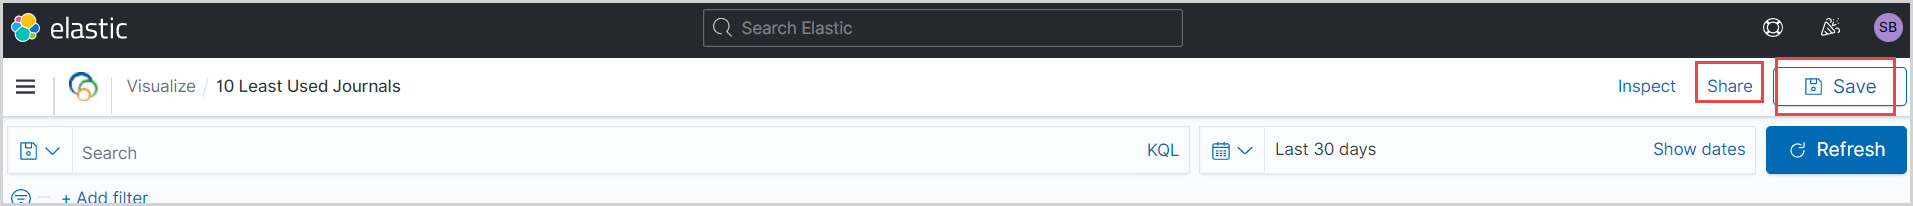
Select the Save option in the upper right corner of the Visualization screen after creating a visualization.
To open a saved visualization or dashboard, find and select the title of your visualization from the list of saved objects on the Visualizations screen. You can also use the Search bar to retrieve a visualization by name.
To share a visualization:
From the desired visualization, select the Share option in the upper right corner. Share options include:
- Embed code
- Permalinks
- PDF Reports
- PNG Reports