Turnaround Time dashboards
Find your average lending and borrowing turnaround times on the Tipasa home page with the Turnaround Time dashboard. Access the Turnaround Time dashboard underneath the Quick Links section.
Use the Turnaround Time dashboard to become more aware of your turnaround statistics over time and track the impact of workflow changes you make to your ILL process.
The dashboard includes two charts, separated into two tabs:
- Lending
- Borrowing
Weekly averages serve as individual data points for the last 365 consecutive days. Hover over the individual data points to display the week's start date and the average turnaround time for that week. The most recently available figures are from the previous week.
- By default, average turnaround times for copies are displayed. Select the Loans or Copies & Loans radio buttons located in the top right corner of the chart to change the view.
- If there is no relevant activity in a week, the value displayed on the chart will be 0.
- The X-axis dates represent the start of the week for the corresponding average turnaround time value and adjust over time.
- The Y-axis values represent turnaround time in days and the range will change depending on each library's turnaround time value ranges.
For additional information about improving your library's turnaround time for borrowing and lending, see Improve turnaround time.
Turnaround Time - Borrowing
This graph represents the average turnaround time your library is getting for loans and copies from all supplying libraries. Turnaround time is measured from when the request is produced and sent to lenders to when the borrower marks the item as received.
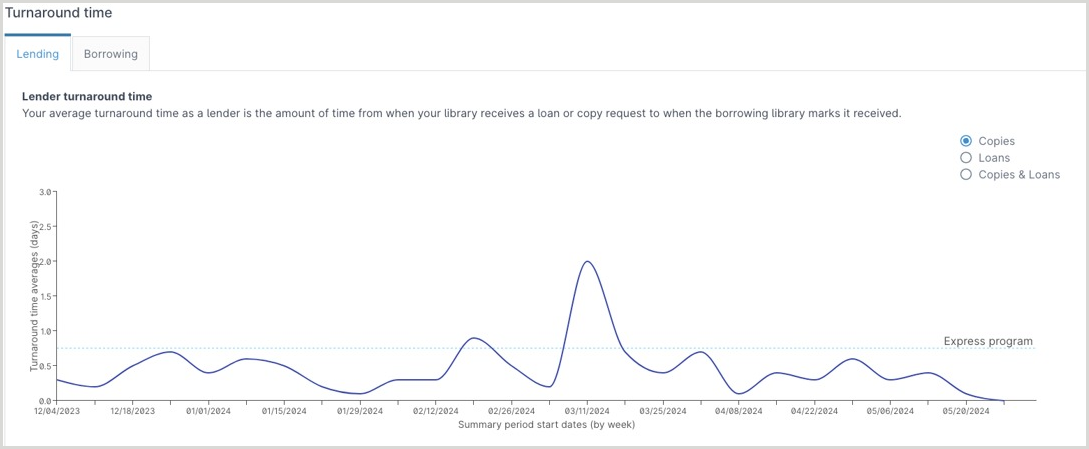
Turnaround Time - Lending
This graph represents the average turnaround time from when your library receives a loan or copy request to when the borrowing library marks it received. Turn around time is measured from when your library is first assigned the lending request to when the borrowing library marks the item as received.
Note: The Lender Activity Overview Report or Lender Transaction-Level Detail Report in OCLC Usage Statistics measures the turnaround time from when the lender is assigned to when the lender shipped the item. See WorldShare Interlibrary Loan Reports for more information.
- See the impact of shipping time by comparing monthly lending turnaround time figures in the Lender Activity Overview Report from OCLC Usage Statistics to what is seen in the Turnaround Time dashboard on the Tipasa home page. The difference between the two values reflects the impact of shipping time.