Run reports
Run a standard report
- In the left navigation, click Reports.
- Click a report category accordion to expand the menu.
- Click the name of the report you wish to run. The report will open in a new browser tab.
- Enter the required prompt values.
(Optional) Enter or adjust any optional prompt values. See Prompts window below for more information. - Click OK to run the report.
Watch a video
Start here: Standard reports
Run a standard report (Report Designer only)
With report authoring permission, you can access metadata reports from Reports in the left navigation.
- In the left navigation, click Report Launch Pad.
- (Optional) Click Continue in the Select Report Scope window.
- In the left navigation, click a report category folder.
- Double-click the name of the report you wish to run. The report will open in a new tab in the Report Launch Pad.
- Enter the required prompt values.
(Optional) Enter or adjust any optional prompt values. See Prompts window below for more information. - Click OK to run the report.
Prompts window
A standard report will only run once all fields in the Prompts window are marked with a green check mark.
When you run a standard report, the Prompts window may require you to enter a value for a required field prior to running the report. Prompts vary depending on the data in a specific report, and you may be required to enter several values before a report will run. Standard reports use a combination of three different prompt fields: Optional, Pre-populated, and Required.
- Report prompts window - Example
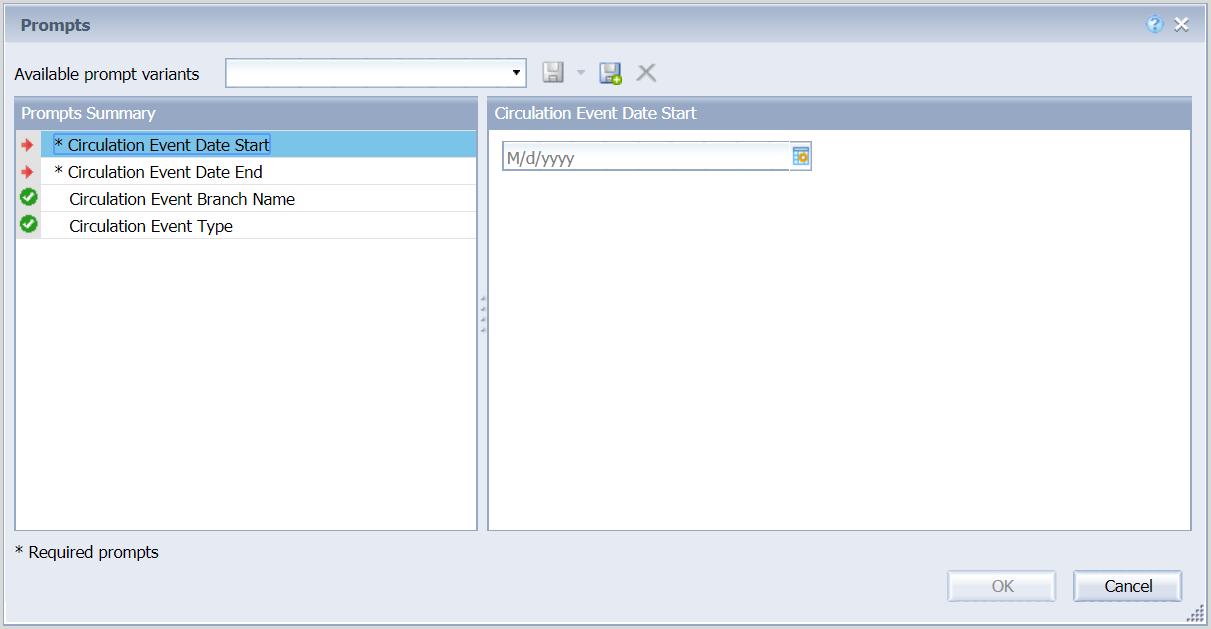
Optional fields
An optional field, identified by a green check mark ( ), may be left blank. If an optional field is left blank, the report will display all available values for that field. If a value is entered for an optional field, the report will display data for that value only (e.g. a specific branch).
Pre-populated fields
A pre-populated field, identified by a green check mark (), provides a value for a prompt. You can modify a pre-populated field or accept the default value.
Required fields
A required field, identified by a red arrow (![]() ), is blank and requires you to provide a value before the report will run. If the field is a date prompt, it will provide an example of how to format the date in the text field (e.g. M/d/yyyy). Many date prompts provide a calendar widget, which allows you to set the date from a calendar.
), is blank and requires you to provide a value before the report will run. If the field is a date prompt, it will provide an example of how to format the date in the text field (e.g. M/d/yyyy). Many date prompts provide a calendar widget, which allows you to set the date from a calendar.
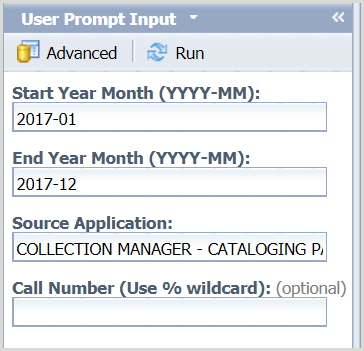
User Prompt Input pane
After you run a report, you can modify your initial prompt selections through the User Prompt Input pane. You can enter new parameters into a field, or click Advanced to launch the Prompts window. Once you have finished modifying the initial prompts, click Run to apply the new prompts to the report data.
- User Prompt Input pane - Example